Chapter 5 Transforming spatial data to 3D forms
- What tools exist to convert data to meshes in R?
- What forms of mesh data are available?
The key package is rgl, the OpenGL package for R. This tends to be very low level, but has improved helpers and is becoming easier to use. The key functions are plot3d(), lines3d() and points3d() and these are used just like the 2D base funtions in R (with the ‘3d’ on the end).
For polygons we first need to create triangles, and then use triangle3d(). For rasters we can create triangles or quads, and use quads3d(). There is also a mesh type object, mesh3d to store data with material properties. To plot mesh3d we use the shade3d() function.
5.1 Algorithms
Converting points to 3D is really trivial, we only need the X-Y-Z coordinates, and we can set properties directly on them.
Converting lines is also relatively easy, but here we might use a path model, sequential lists of coordinates that imply a connected line, or a segments model where every single individual line segment is specified separately. The segment model is really a mesh, because we have the opportunity to store every coordinate just once and refer to segments by their index.
Converting polygons is much harder, and there are multiple ways to do it. The main division is by near-Delaunay triangulation, or by ear-cutting algorithms.
- near-Delaunay - high quality triangulations, suitable for surface modelling
- ear-cutting - low quality triangulation, suitable for flat surfaces
The main tools available for geospatial data:
- quadmesh (on CRAN) - convert any raster to mesh3d quads, optionally with image textures
- anglr (not on CRAN) - convert any sp, sf lines or polygons to mesh3d triangles
The rgl package has ear-cutting in triangulate3d().
The sfdct package (via RTriangle) has near-Delaunay in ct_triangulate()
The decido package has ear-cutting in earcut().
Converting raster data is available in various ways.
rgl::surface3d(), this is analogous to the old baseimage()function that can takex, y, z = matrixquadmesh::quadmesh(), converts raster, matrix, some stars tomesh3drayshaderdetermines elevation colouring from a matrix, and has many plotting helpers, and the best looking 3D plots and animations
5.2 raster
A straightforward way to convert a raster layer to rgl mesh3d (cell values are Z-coordinate) is quadmesh.
5.3 vector
Lines, and polygons in spatial classes can be converted using the anglr package.
plot3d() will create the rgl plot and return a mesh3d() object
as.mesh3d() will convert the object directly (very much in-development)
The approach to converting polygons to mesh uses the functions TRI() or DEL() both produce triangulations, one with ear-cutting and one with “constrained Delaunay” methods. These aren’t ready for general use, so as.mesh3d() and plot3d() are the recommended ways to use the tools for now.
5.4 Image textures
Image-textures is a very powerful way to map imagery onto a surface, the surface can be created from a raster or polygons, and can use quad or triangle primitives.
The concept of texturing has some abstract details to it, but amounts to defining the 0,1 , 0,1 pixel index of the image on the vertices of the mesh. These are defined as $texcoords on the mesh3d object.
Consider a simplified volcano data set as a quadmesh.
library(raster)
vsimpler <- volcano[seq(1, nrow(volcano), by = 4),
                    seq(1, ncol(volcano), by = 4)]
vraster <- raster(list(x = 1:nrow(vsimpler), y = 1:ncol(vsimpler), z = vsimpler), crs = NA)
image(vraster)

logo <- brick(system.file("external/rlogo.grd", package="raster"))
## our logo belongs in the middle of volcano (obviously)
logo <- setExtent(logo, extent(9, 16, 7, 13))
projection(logo) <- NA
plotRGB(logo, add = TRUE)

## from the perspective of the mesh, the image will go where we set the texture
## coordinates as 0, 1, 0, 1 in the index space of the image itself
segments(c(9, 16, 16, 16),
         c(6, 6, 7, 13),
         c(9, 16, 17, 17),
         c(7, 7, 7, 13))

text(9, 6, "0", pos = 1)
text(16, 6, "1", pos = 1)
text(17, 13, "1", pos = 4)
text(17, 7, "0", pos = 4)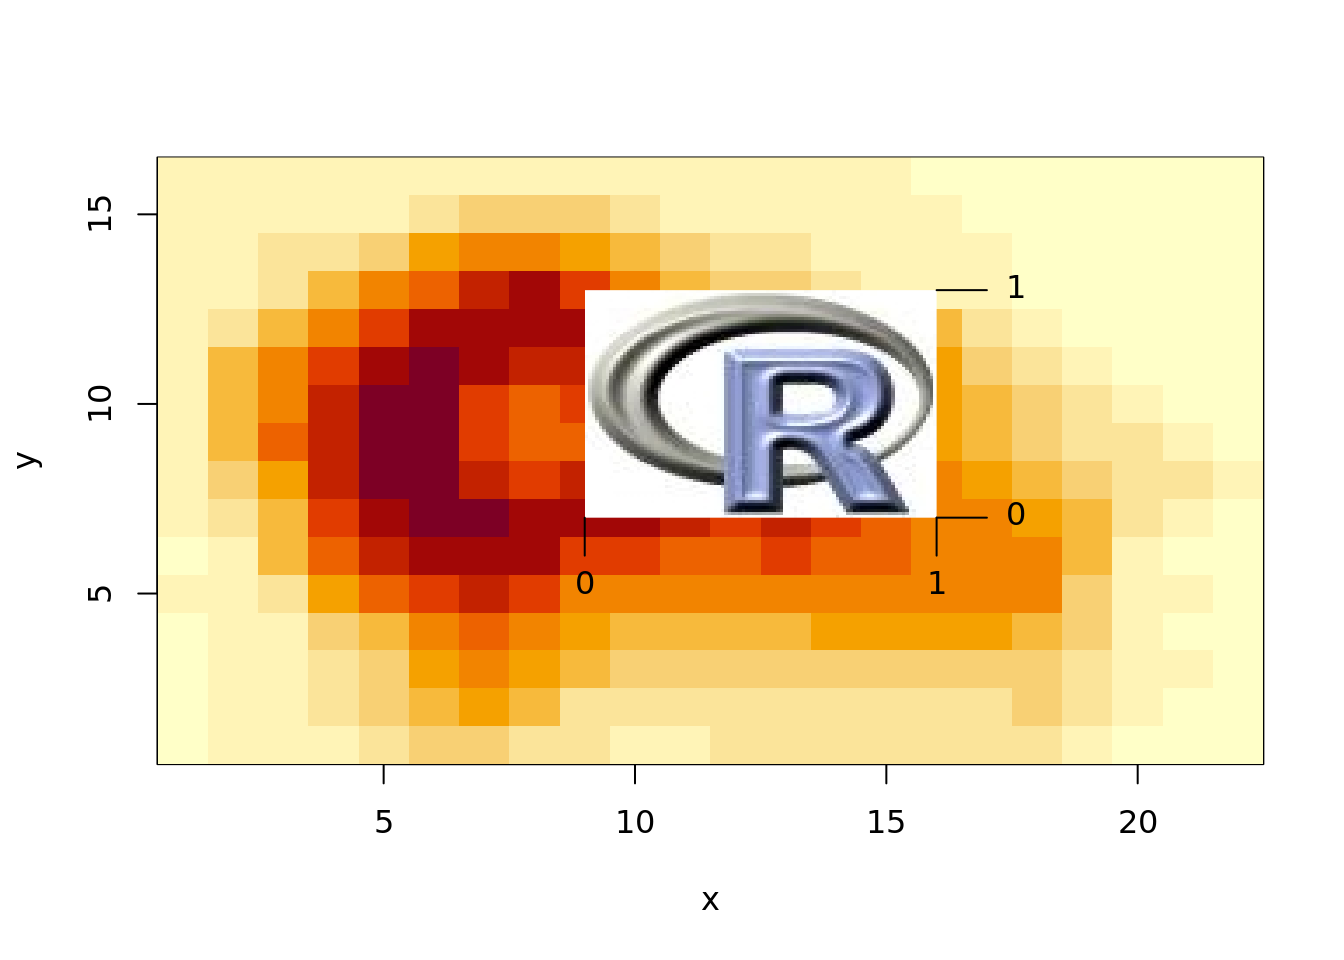
The 2D plot above can be emulated in 3D with quad textures, the resolution of the image and the surface can be completely different.
## writing texture image to /rdsi/PRIVATE/raad/dev/__tmp_mike/Rtmpbyz5Eb/file9e344b44780.pngThis section requires a Mapbox API key to run from scratch - and can’t be shared directly, so it will simply be illustrated.
loc <- cbind(7 + 37.5/60, 51 + 57.6/60)
buffer <- 9000
library(ceramic)

munster_elev <- cc_elevation(loc, buffer, zoom = 12)
munster_imag <- cc_location(loc, buffer, zoom = 14)
The process is a little complicated, but the key is that the elevation raster provides a space in which to map other data too. In this case the raster is in Mercator, and the image is as well. Under the hood we have to map the spatial part of the image into 0, 1, 0, 1 space of a PNG image, but in the final event we get a scene where real-world data may be added directly.
munster_qmesh <- quadmesh::quadmesh(munster_elev, texture = munster_imag)

rgl::shade3d(munster_qmesh, lit = FALSE); rgl::aspect3d(1, 1, .05)

## more exact location of THIS building
merc <- sf::sf_project(cbind(7.59551, 51.96922), from = "+init=epsg:4326", to = raster::projection(munster_elev))
rgl::lines3d(cbind(merc[c(1, 1), ], matrix(c(0, 1000))))
5.5 Triangles or quads from geospatial
This is my work-in-progress approach to meshing any polygon data structure with raster elevation.
This is pseudo code but a real example is used with the North Carolina counties data set in the examples.
5.6 Various other 3D tools in R
rgl::triangulateanddecido::earcutwill triangulate polygons with holes but only suitable for plane-filling, because ugly triangles, no control over size and shape.RTriangle::triangulate(andsfdct::ct_triangulate) do high-quality “near-Delaunay” triangulationsquadmesh::quadmesh()to create rgl-ready mesh3d from a rastercubeview::cubeView()does very compelling interactive raster-cube visualizationmapdeck::mapdeck()a 3D viewer using Uber’sdeck.gldeckglpackage, another package usingdeck.glthreejs- 3D visualization with the ‘three.js’ libraryrayshader- very compelling 3D visualization and animation from matrix height maptylermorganwall/rayrender- general 3D scene creation, animationRvcgpackage on CRAN has a number of mesh-processing and visualization toolshypertidy/silicate,hypertidy/anglr- these are evolving togethershort workshop on using A-Frame Virtual Reality with geospatial data: https://github.com/MilesMcBain/gis_vs_web3D
coolbutuseless/threed- transformations on 3D objects