Speaking Simple Features
Michael Sumner
2019-01-09
sfbabel.RmdSimple features
In simple features, we can put more information on the coordinates in the form of either ‘Z’ or ‘M’, or both.
Maunga Whau traversal
This epic journey takes us to the top of a volcano.
## Loading required package: spdata("volcano")
## prepared with dput(lapply(locator(), round, 3))
xy_traverse <- do.call(cbind, structure(list(x = c(0.161, 0.186, 0.202, 0.228, 0.252, 0.27,
0.285, 0.292, 0.309, 0.349, 0.382, 0.41, 0.446, 0.479, 0.552,
0.607, 0.614, 0.591, 0.55, 0.506, 0.471, 0.45, 0.405, 0.387,
0.375, 0.359, 0.343, 0.342, 0.344, 0.324, 0.262, 0.246, 0.22,
0.206, 0.206), y = c(0, 0.029, 0.037, 0.053, 0.053, 0.06, 0.094,
0.121, 0.155, 0.2, 0.219, 0.245, 0.264, 0.274, 0.286, 0.317,
0.349, 0.384, 0.406, 0.423, 0.427, 0.445, 0.48, 0.496, 0.515,
0.537, 0.584, 0.625, 0.661, 0.698, 0.698, 0.682, 0.631, 0.563,
0.545)), .Names = c("x", "y")))
rastergrid <- raster(t(volcano[,ncol(volcano):1 ]))
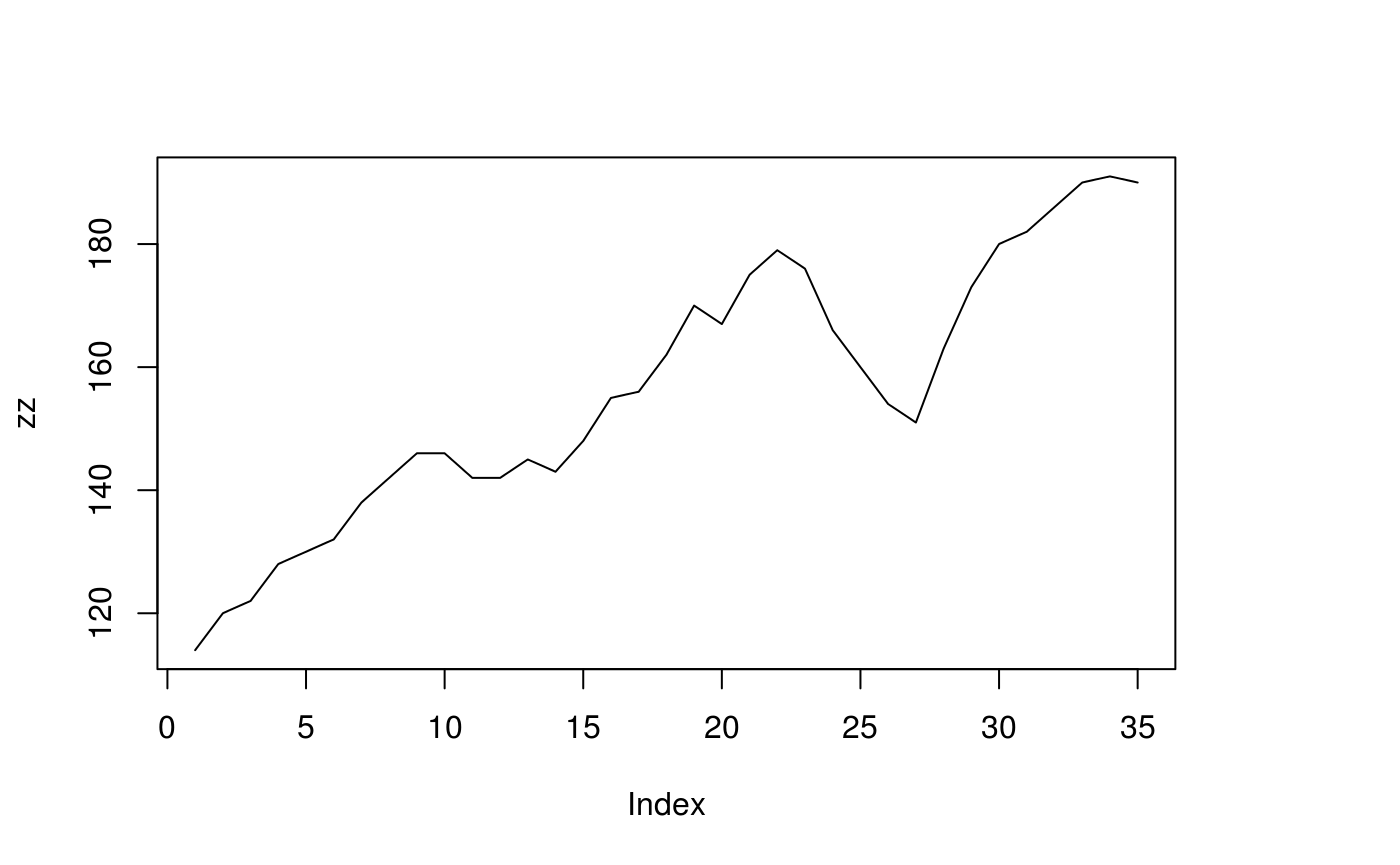
zz <- extract(rastergrid, xy_traverse)
plot(rastergrid, col = viridis::viridis(10))## Registered S3 methods overwritten by 'ggplot2':
## method from
## [.quosures rlang
## c.quosures rlang
## print.quosures rlang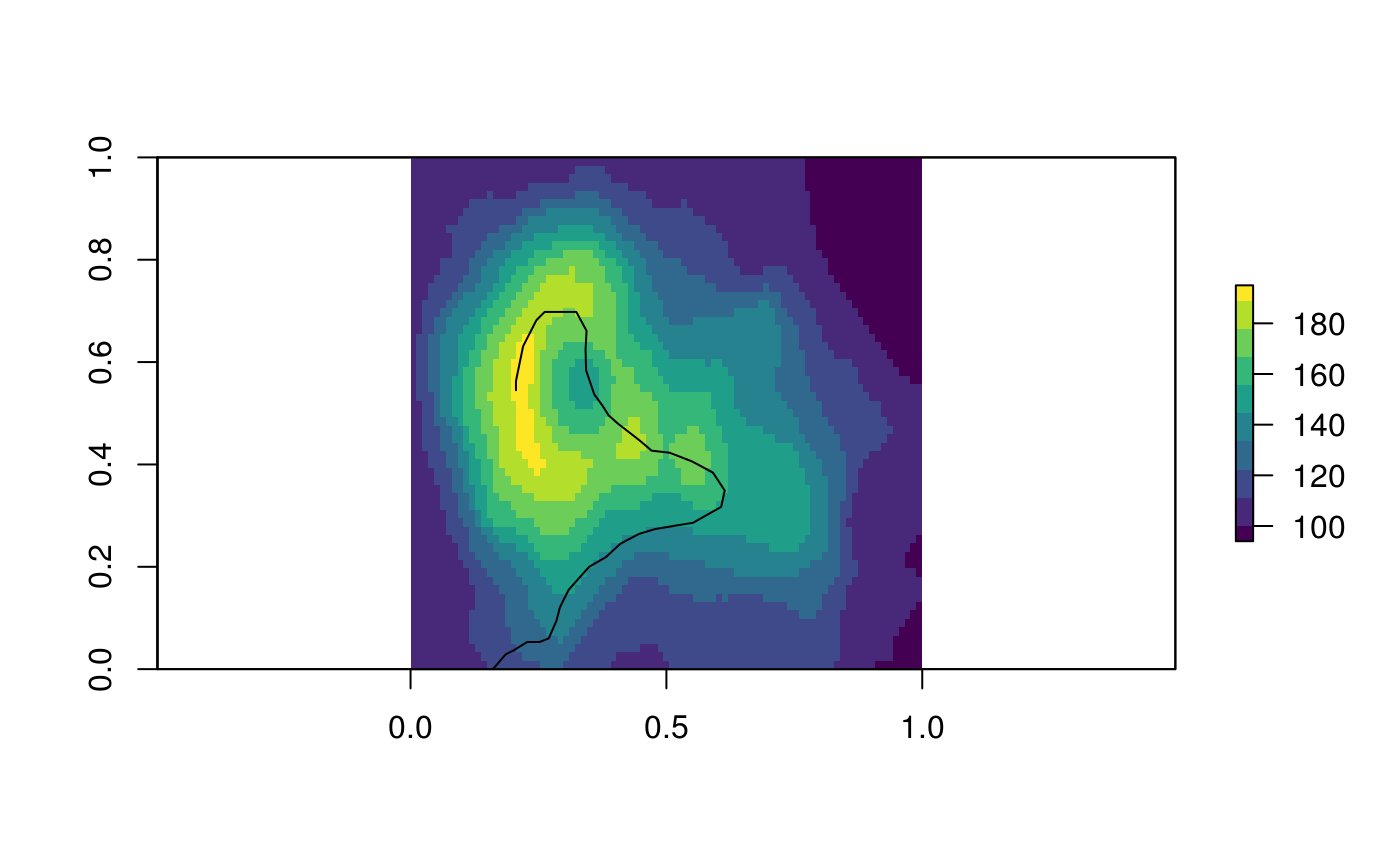
Having done all of this work, we write a nice compact report.
## Linking to GEOS 3.5.0, GDAL 2.2.2, PROJ 4.8.0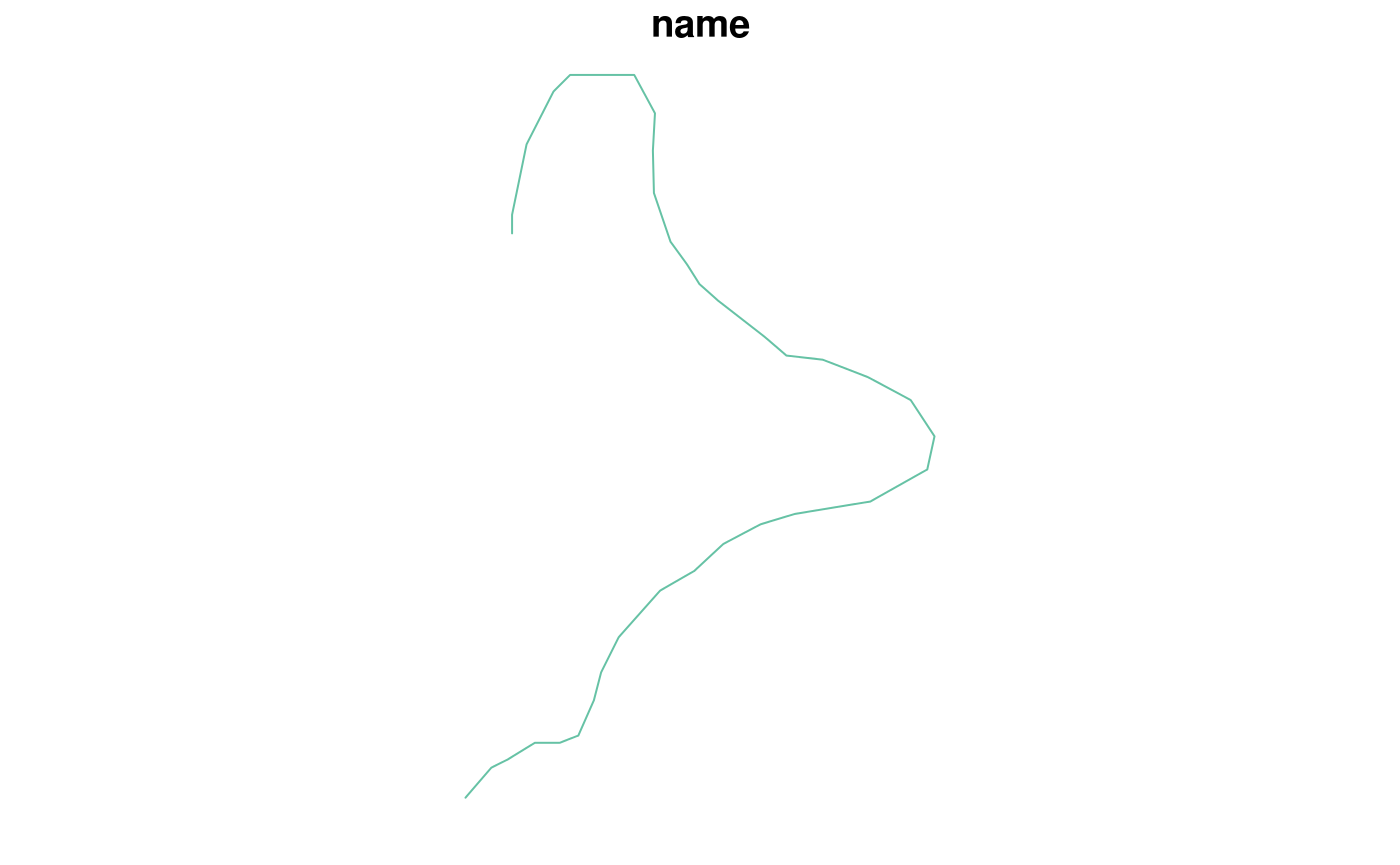
## Simple feature collection with 1 feature and 1 field
## geometry type:  LINESTRING
## dimension:      XYZ
## bbox:           xmin: 0.161 ymin: 0 xmax: 0.614 ymax: 0.698
## epsg (SRID):    NA
## proj4string:    NA
##            name st_sfc.st_linestring.cbind.xy_traverse..zz...
## 1 epic traverse                LINESTRING Z (0.161 0 114, ...
What is the relational structure of this object?
TBD
## $o
## # A tibble: 1 x 3
##   name               st_sfc.st_linestring.cbind.xy_traverse..zz... object_
##   <fct>                                               <LINESTRING> <chr>
## 1 epic trav… Z (0.161 0 114, 0.186 0.029 120, 0.202 0.037 122, 0.… axtptH3…
##
## $b
## # A tibble: 1 x 1
##   object_
##   <chr>
## 1 axtptH3yMM
##
## $bXv
## # A tibble: 35 x 2
##    order_ vertex_
##     <int> <chr>
##  1      1 gSjD8EuXdu
##  2      2 RNtygcBgb3
##  3      3 8KyA2eSakm
##  4      4 DcqIrcDLLu
##  5      5 5liriKQmls
##  6      6 l15xhvyxWm
##  7      7 0Lo1GsXbXo
##  8      8 Z6mUGaPZ1g
##  9      9 sDRHumqMOC
## 10     10 405IU2YIip
## # … with 25 more rows
##
## $v
## # A tibble: 35 x 4
##       x_    y_    z_ vertex_
##    <dbl> <dbl> <dbl> <chr>
##  1 0.161 0       114 gSjD8EuXdu
##  2 0.186 0.029   120 RNtygcBgb3
##  3 0.202 0.037   122 8KyA2eSakm
##  4 0.228 0.053   128 DcqIrcDLLu
##  5 0.252 0.053   130 5liriKQmls
##  6 0.27  0.06    132 l15xhvyxWm
##  7 0.285 0.094   138 0Lo1GsXbXo
##  8 0.292 0.121   142 Z6mUGaPZ1g
##  9 0.309 0.155   146 sDRHumqMOC
## 10 0.349 0.2     146 405IU2YIip
## # … with 25 more rows
##
## attr(,"class")
## [1] "map_table" "list"