Chapter 5 SOmap
The SOmap package is intended to solve some of these problems, and provide an easier way to produce nice-looking maps of Antarctica and the Southern Ocean. It is primarily focused on maps in polar stereographic projection (although the SOmap_auto function extends this to other projections). SOmap won’t necessarily get you exactly the map you want. But if it doesn’t, it should hopefully get you close enough that you can make modifications to suit your exact purposes.
Please bear in mind that SOmap is still in development, and so its functionality (function parameters and/or behaviour) may change.
5.1 Installation
Running code in this section is not required, we will discuss the use of SOmap.
To run the code in this session, you can run the following to install SOmap.
By default, SOmap works with base graphics (and associated functionality from packages such as raster and sp). It is also possible to work with ggplot2-based graphics, as described below.
Start by loading the SOmap package and define some colours:
5.2 Circumpolar maps
A basic circumpolar map in polar stereographic projection:
## Loading required namespace: rgeos
SOmanagement() provides a number of contextual layers such as MPA boundaries and management zones.
SOmap(trim = -40) ## plot to 40S
## add the exclusive economic zones management layer
SOmanagement(eez = TRUE)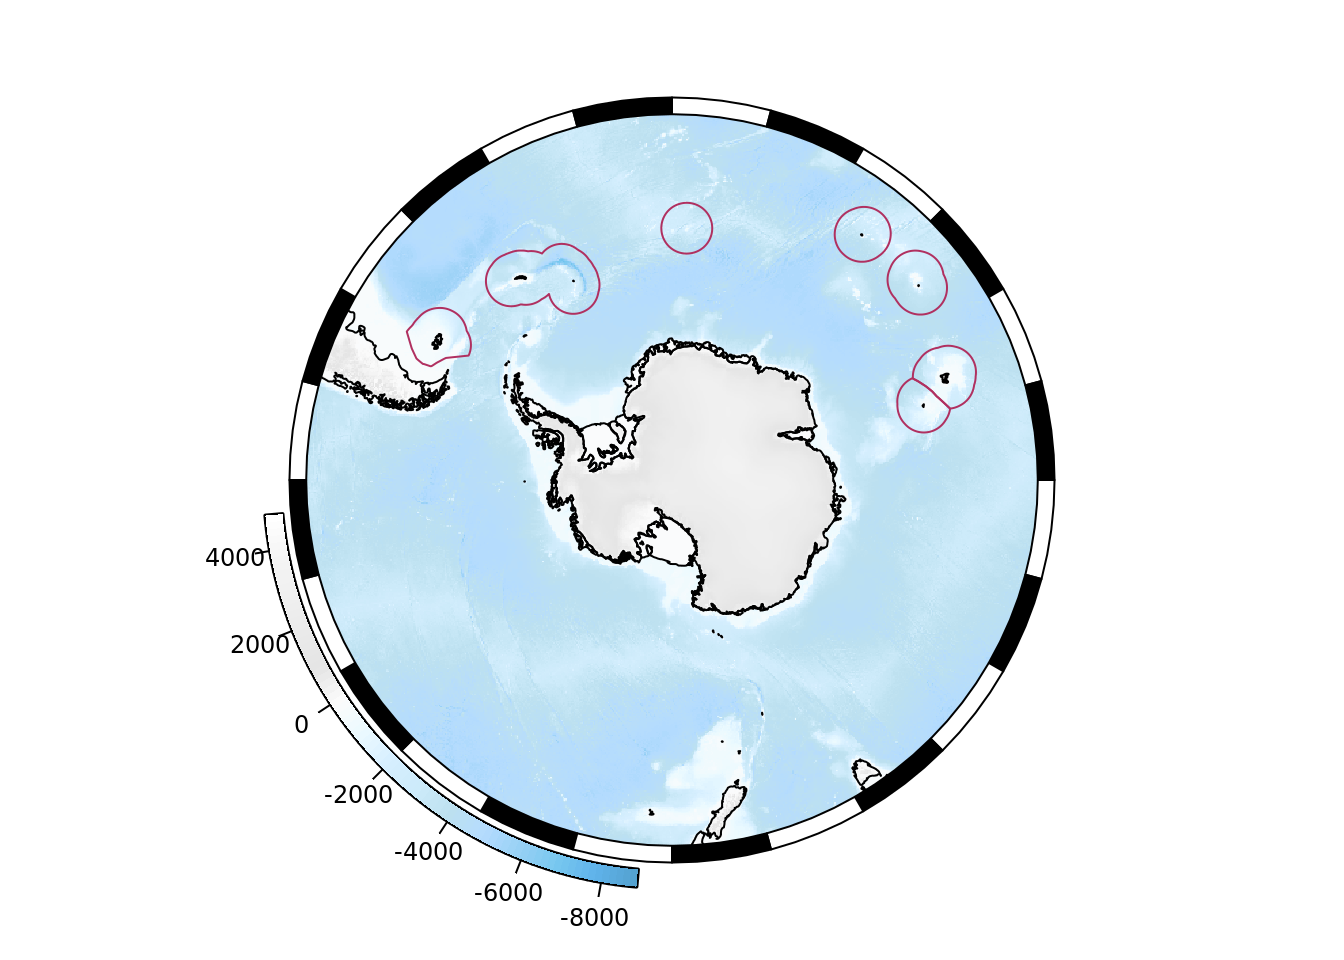
5.3 Adding points
## some longitude/latitude data
library(sp)
my_points_ll <- data.frame(lon = seq(0, 350, by = 10), lat = -55, z = runif(36))
coordinates(my_points_ll) <- c("lon", "lat")
projection(my_points_ll) <- "+proj=longlat +datum=WGS84"
This needs to be reprojected to match our map before plotting. The SOproj function does this:
## reproject to our SOmap projection
my_points <- SOproj(my_points_ll)
## and plot
SOmap()
plot(my_points, col = "blue", add = TRUE)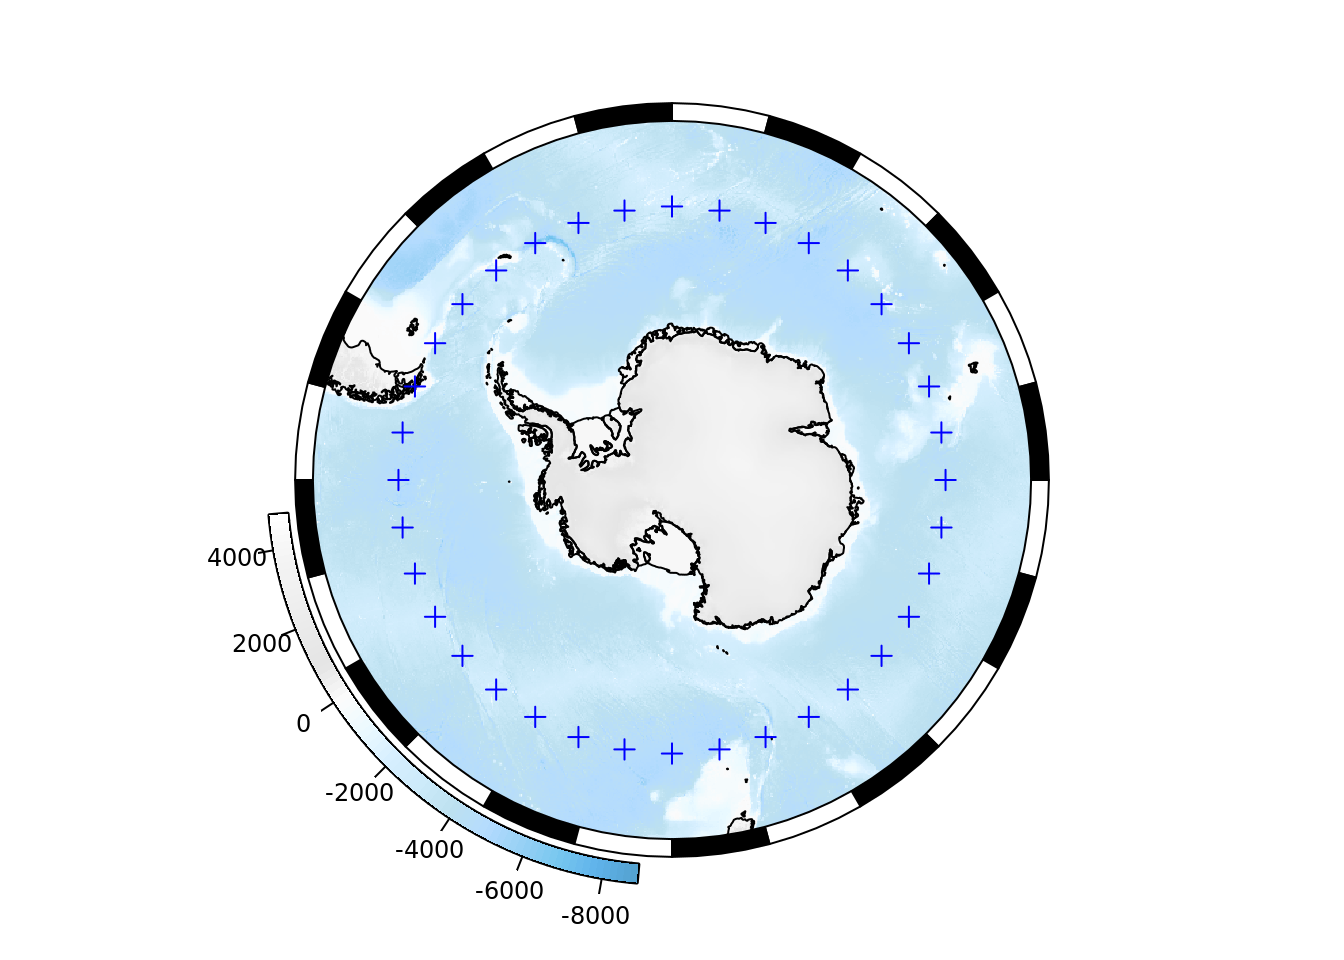
Or use SOplot to reproject and plot in one step:

5.4 Exercise 5
Why does SOplot() not need to use the projection? How does it know to plot the data correctly onto an existing plot?
5.4.1 EX 5 ANSWER
EX 5 SOLUTION
The reason is that the SOmap() function recorded the projection in use. The functions to plot in SOmap are intended to be used in sequence, and by default we are adding map data or objects to an existing plot. The map projection in use is managed by these functions.
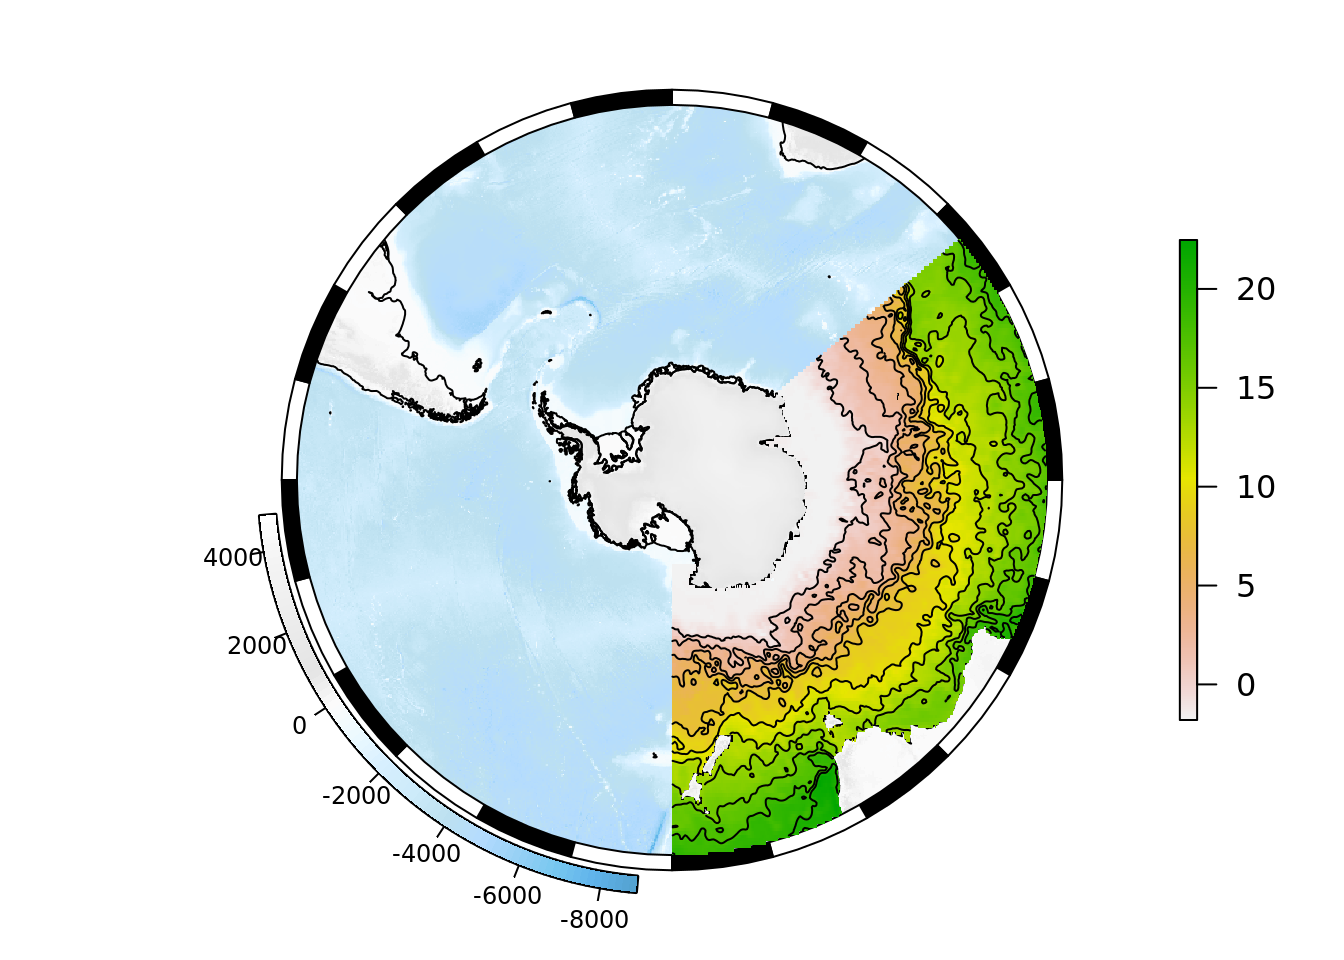
5.5 Adding data layers
SOmap() builds a reasonable map on its own, and we can add a variety of layers to that.
SOmap(trim = -30)

sst_local <- crop(rotate(sea_temp), extent(50, 180, -75, -30))
SOplot(sst_local)

sst_contours <- raster::rasterToContour(sst_local, levels = seq(0, 20, by = 2))
SOplot(sst_contours, add = TRUE)