Triangles for spatial data in R
Triangles are everywhere in spatial work: drawing polygons, joining up points, interpolating, terrain, and the meshes behind spatial models. This is a friendly guide to what triangulation is, which R package to reach for, and why the choice matters.
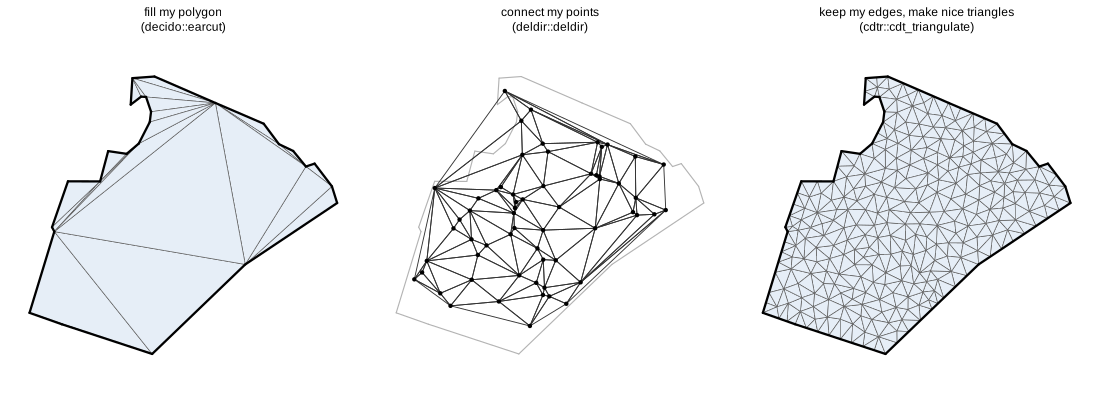
One county, three kinds of triangulation. Start here to see why they differ.
Start here
What a triangulation is, the three questions most people are really asking ("fill my polygon", "connect my points", "keep my edges and make nice triangles"), the traps that catch people out, and which package to try first.
How the engines differ
The same small examples through ear cutting, GEOS and a full mesher, side by side; what silicate and anglr tried before; and why laridae is built on CGAL.
Package survey
A reference to about 35 R packages: the algorithm and library behind each, what it takes and returns, and what it can and cannot do, with a look at Python.
Notes
What "2D", "3D" and "2.5D" mean to different people, triangles on the sphere, and what interpolation on a triangle mesh does and does not promise.
Benchmark
For developers: speed, memory and mesh quality on country boundaries, from 23 thousand to 6.8 million vertices.
Gridded data has its own thorny word. Regular in what? is a short companion book on why a grid is regular, rectilinear or curvilinear only in a frame, and on the communities and software that blur the difference.
Under the hood, trianglewins is a test harness: it runs the same inputs through laridae (CGAL), cdtr (CDT), trowel (spade) and RTriangle (Triangle) and checks the results with code that belongs to none of them. See the repository. The development roadmap lives in hypertidy/meshcore.