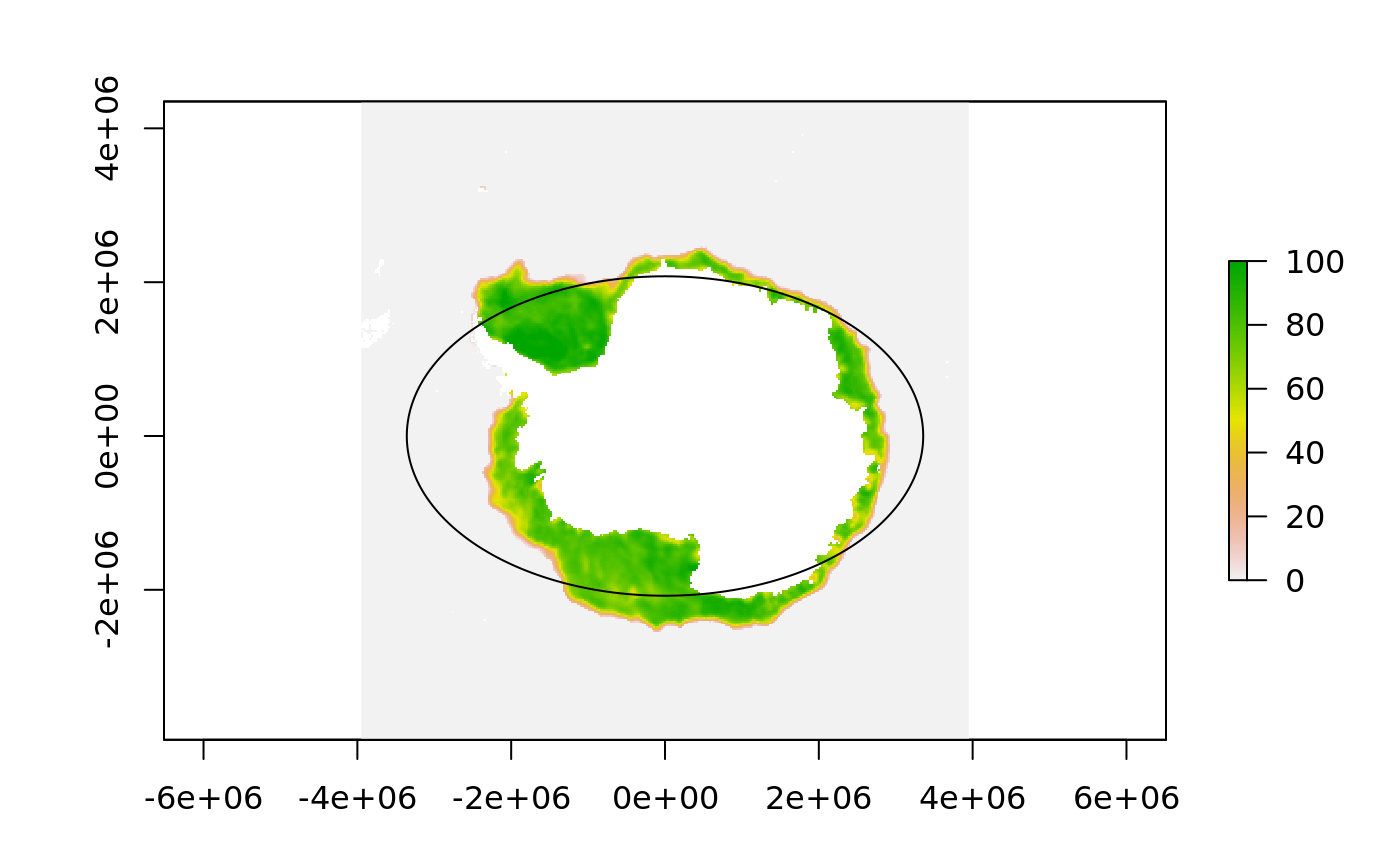
Latitude circle
latitudecircle.RdCreate a circular polygon using a latitude value in a map projection. The longitude range can be modified from global to give a portion of a circle.
latitudecircle(latitude = 0,
  crs = "+proj=stere +lon_0=0 +lat_0=-90 +lat_ts=-71 +ellps=WGS84",
  lonlim = c(-180, 180), nverts = 1800)
Arguments
| latitude | latitude value for the boundary, defaults to 0 |
|---|---|
| crs | map projection to use, defaults to southern Polar Stereographic true scale at -71S |
| lonlim | the range of longitude to use, defaults to entire globe |
| nverts | total number of vertices to use, see Details |
Value
SpatialPolygonsDataFrame
Details
The argument nverts controls the total number of vertices of the circle
within a linearly within the lonlim range of longitudes at latitude
This is for use on classic polar projections centred on the north or the south pole, particularly Polar Stereographic and Lambert Azimuthal Equal Area but will also work with some caveats on other families and situations. We have not explored this more general use. Feel free to contact the maintainer if you have interest in less typical usage or find problems.
Examples
#> Warning: ignoring multiple latitude values, using first#> class : SpatialPolygonsDataFrame #> features : 1 #> extent : -12367392, 12367392, -12367396, 12367377 (xmin, xmax, ymin, ymax) #> crs : +proj=stere +lon_0=0 +lat_0=-90 +lat_ts=-71 +ellps=WGS84 #> variables : 1 #> names : latitude #> value : 0