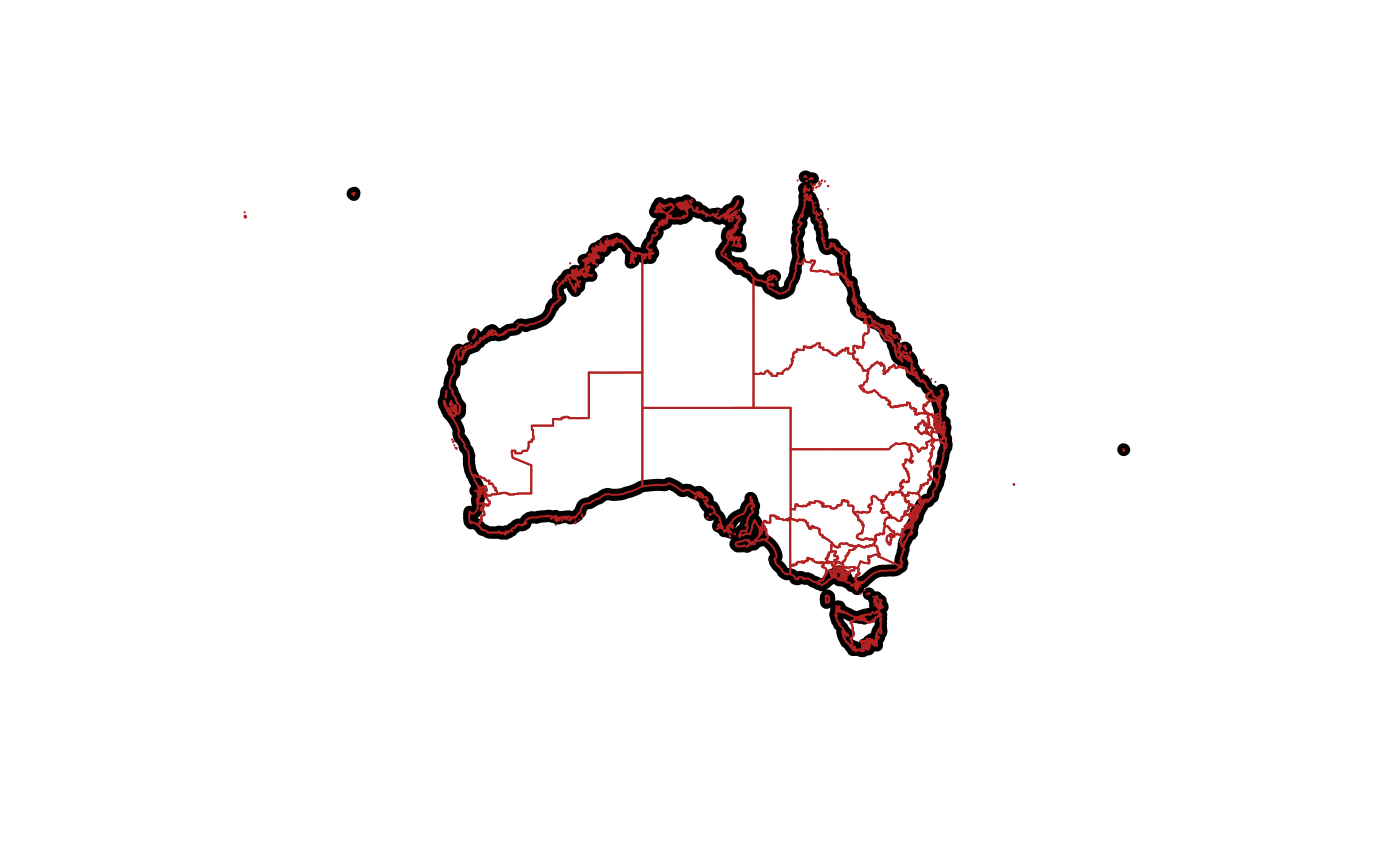
Draw a map of Australia, with or without states.
ozmap(x = "states", ..., add = FALSE)
Arguments
| x | name of data set to use, default is |
|---|---|
| ... | arguments passed to ... |
| add | add to existing plot, |
Value
the data set used, in 'sf' format
Details
outline data is purely in longitude-latitude form, see
ozmap_data() to obtain the data itself.`
See abs_ste for more detailed versions from the Australian Bureau of Statistics.
An example is 'abs_ste' which means 'State and Territory', and
so is a more detailed version of 'states'.
ozmap() uses the sf package to plot, but does so by only plotting the
geometry rather than every colum, and leaves the plot region ready for overplotting with other
data.
See also
ozmap_data
Examples
ozmap()ozmap("country", lwd = 6)ozmap("abs_ced", add = TRUE, border = "firebrick") ## commonwealth (national) electoral divisions