The goal of mapwtf is to plot topography for simple maps anywhere. Might become a ‘automap()’ like the ‘SOmap_auto()’ function in SOmap package.
Example
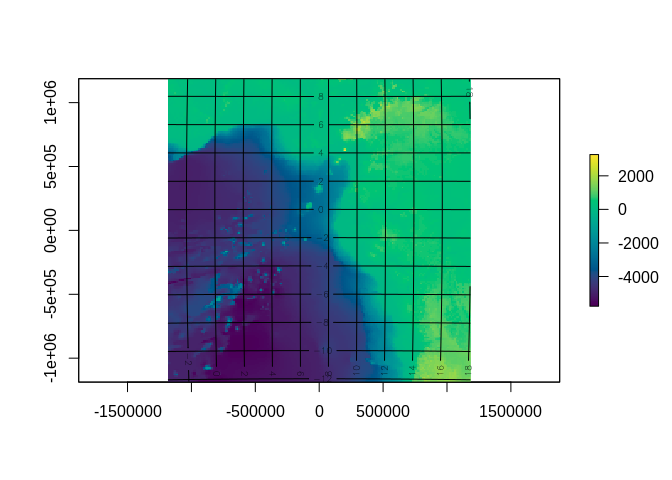
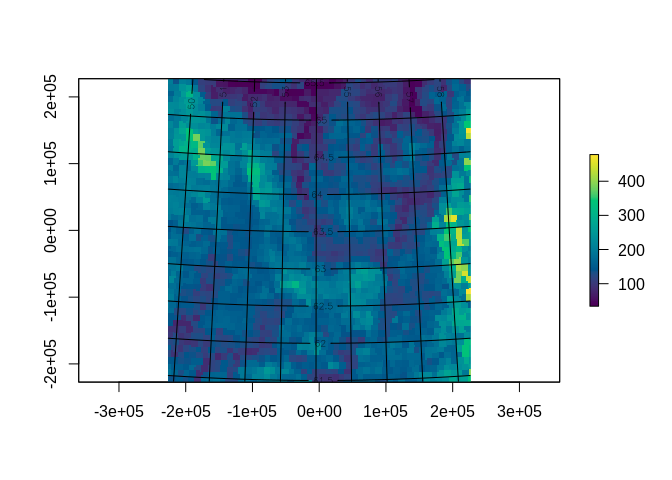
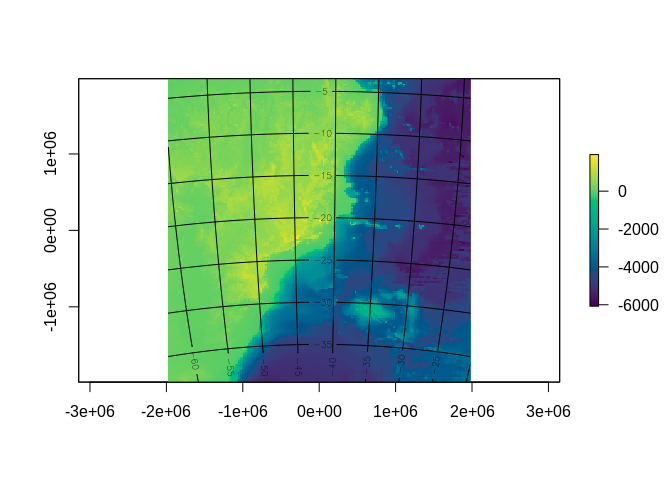
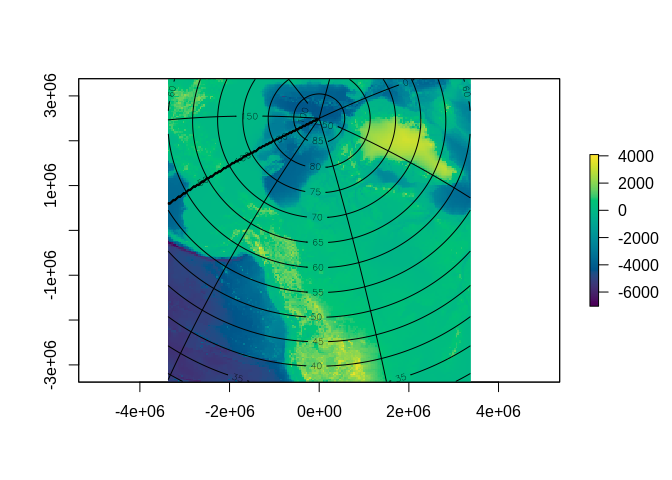
This is a basic example which shows you how to plot topography anywhere in any projection on the earth. Just replace ‘reg’ with your projected raster to fill it with elevation values using populate_topo().
library(mapwtf)
for (i in seq_len(5)) {
  reg <- any_region(width = runif(1L, 50000, 5e6))
  x <- populate_topo(reg)
  raster::plot(x, col = hcl.colors(256))
  grat(x)
}
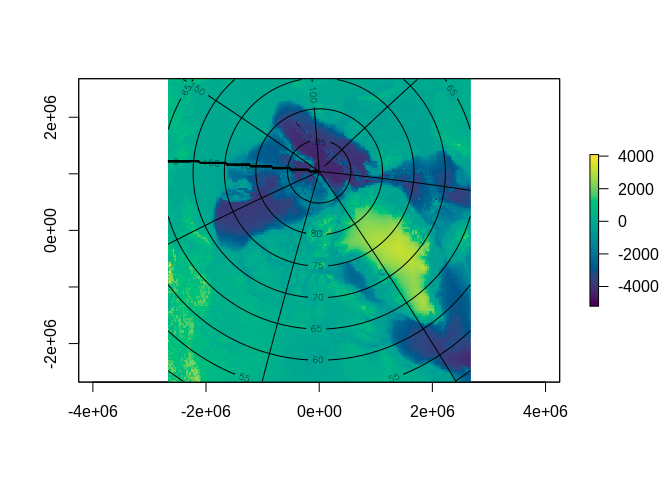
reg <- any_region(proj = "stere", width = 7e6, lat_0=-90, lon_0=147, lat_ts=-75)
x <- populate_topo(reg)
raster::plot(x, col = hcl.colors(256))
grat(x)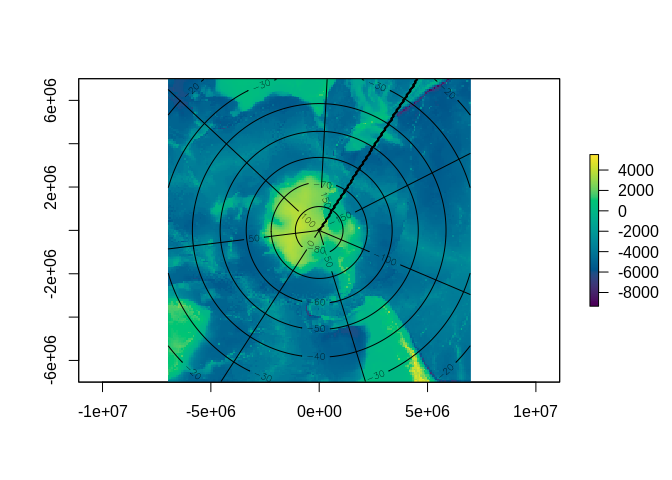
Code of Conduct
Please note that the mapwtf project is released with a Contributor Code of Conduct. By contributing to this project, you agree to abide by its terms.